From Miles to Microcontrollers: Building a Custom Strava Dashboard

There is something deeply satisfying about seeing your hard work visualized. While I love diving into the deep analytics provided by the statistics-for-strava project, I wanted a way to see my progress without opening a browser or checking my phone. I wanted a physical object on my desk that whispered (or shouted!) my training load at me throughout the day. (viz:Motivation to get off my ass.)
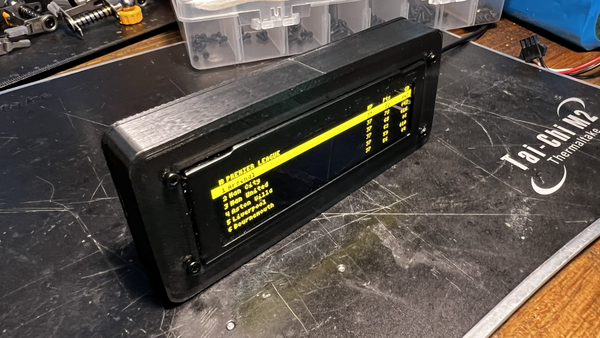
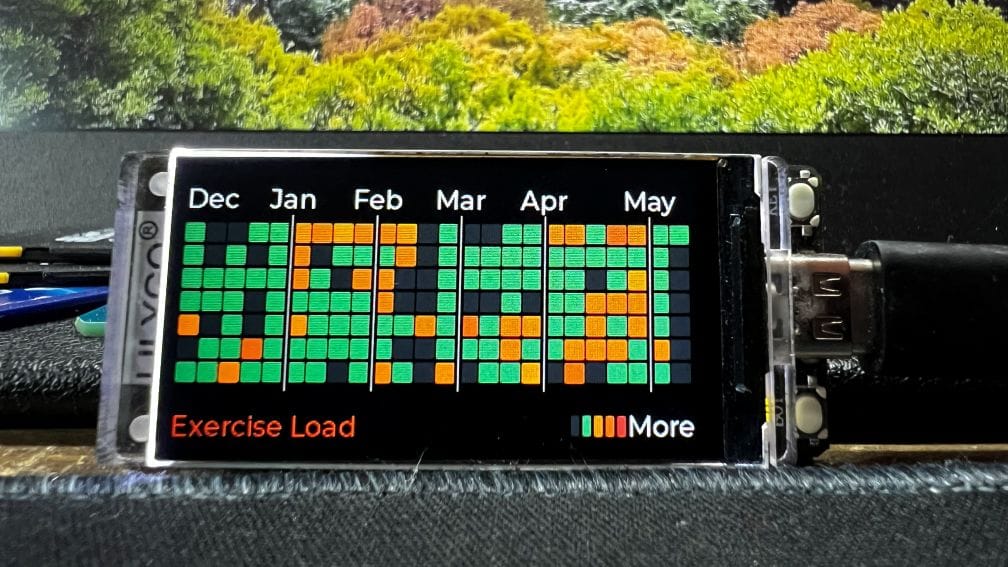
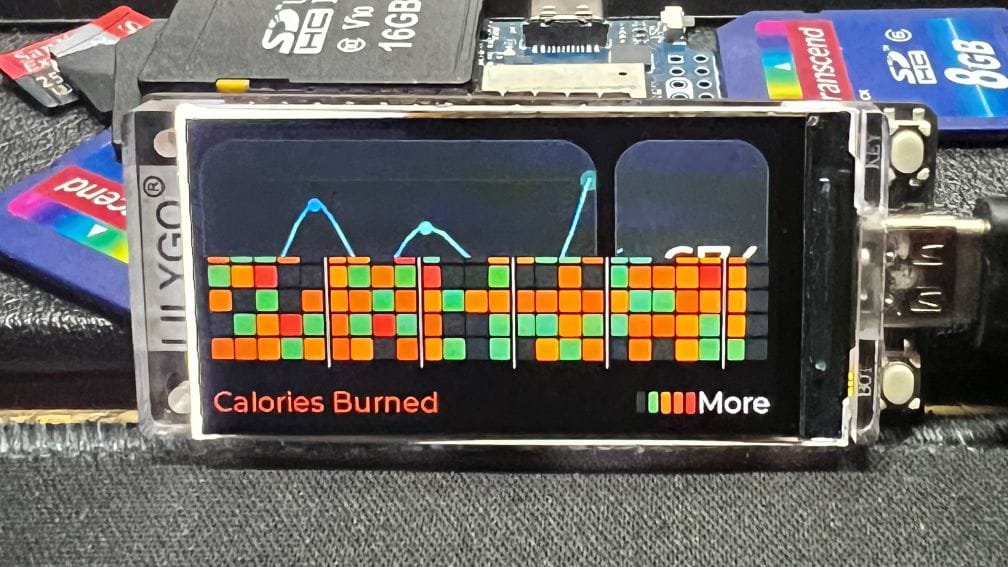
Enter the Strava Exercise Load Monitor; a standalone dashboard powered by the LilyGo T-Display S3.
The Vision: A Tangible Heatmap
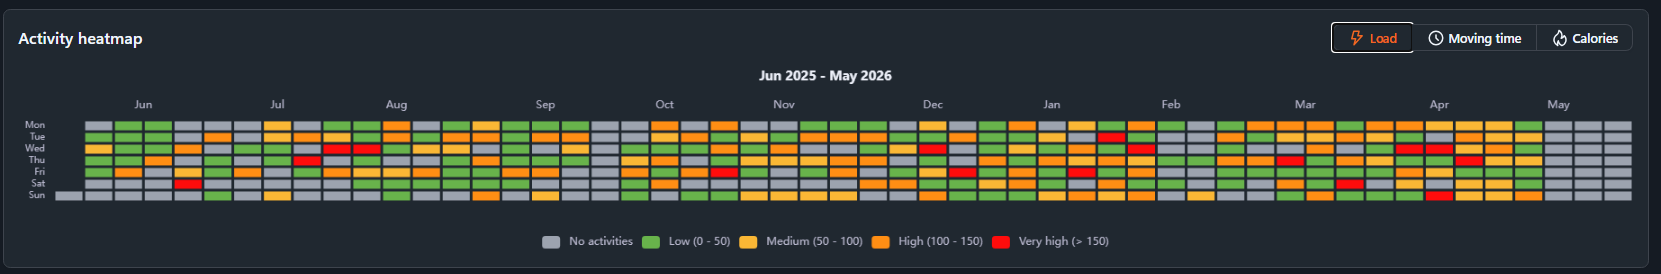
The goal was simple; take the gorgeous 53-week heatmap and activity stats from Robin Ingelbrecht's project (hosted on one of my docker servers) and shrink them down onto a 1.9-inch LCD. Using an ESP32-S3, I could create a device that wakes up, fetches my latest stats from a local bridge service, and cycles through various "screens" of data.
What the Dashboard Tracks:
- Exercise Load Grid: A 53-week heatmap showing minutes trained per day.
- Calories Grid: A color-coded version of the heatmap focused on energy burn.
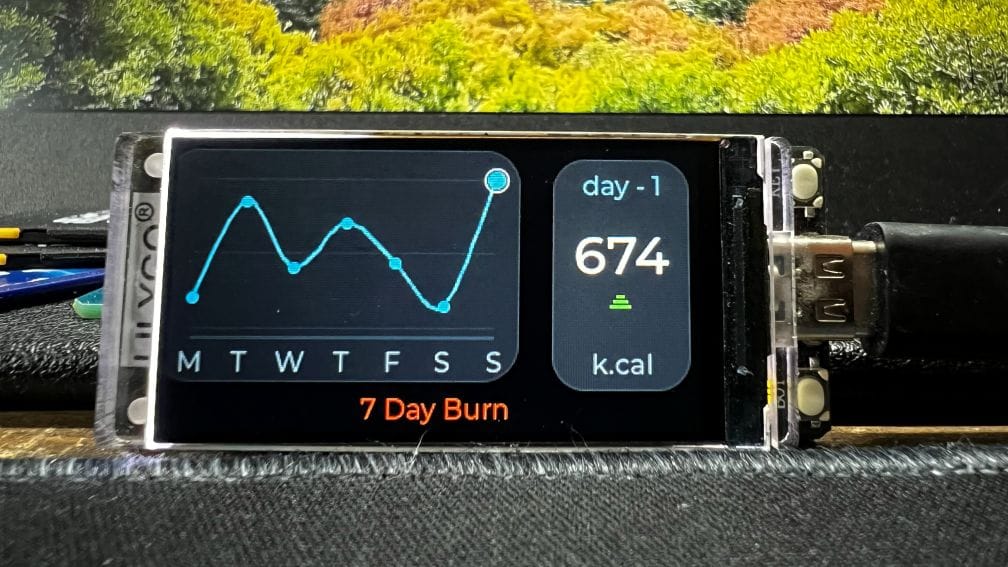
- 7-Day Burn: A sparkline showing your calorie trend over the last week.
- Stats Cards: Highlights for the busiest day of the year and total monthly hours.
The Tech Stack
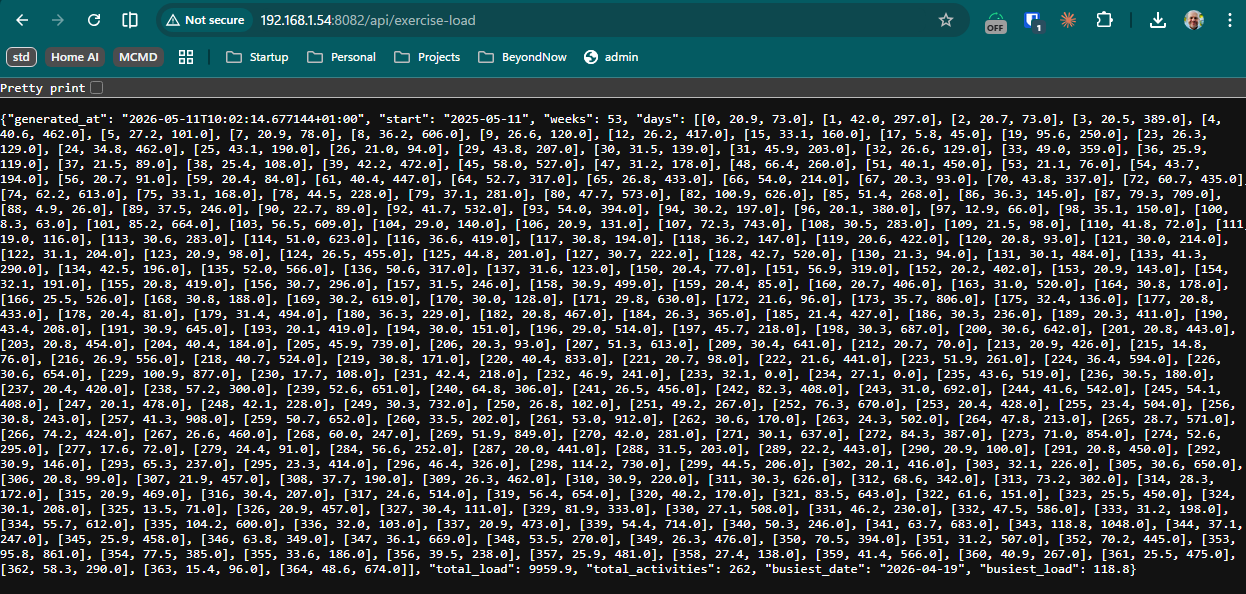
The architecture is split into two halves. Since the ESP32 isn't great at parsing massive SQLite databases directly, I wrote a lightweight Python bridge. This script lives on my local server, reads the Strava database, and serves up a slim JSON payload that the T-Display S3 can easily digest.
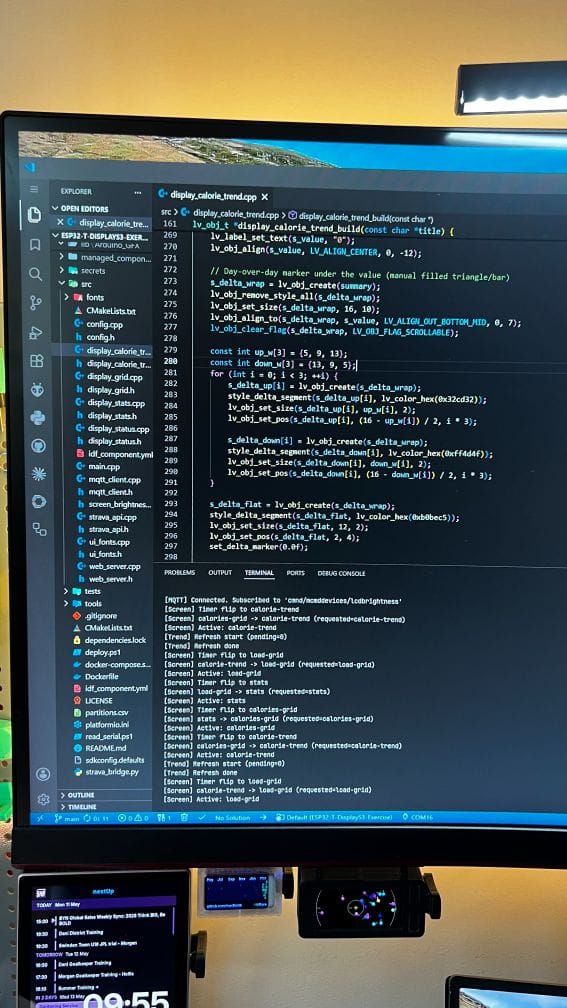
On the hardware side, the firmware is built using PlatformIO and Arduino, utilizing LVGL (Light and Versatile Graphics Library) for the UI.
The LVGL "Object" Struggle
I have to be honest; while the end result looks polished, getting there with LVGL v9 was a massive headache. LVGL is incredibly powerful, but it is also incredibly verbose.
Because the dashboard features a 53-week grid, I had to manage hundreds of individual objects. In LVGL, every single square in that heatmap is an object. Every label, every container, and every trend line marker has to be initialized, styled, and parented.
When you are creating a grid of 371+ squares (53 weeks * 7 days), the code quickly turns into a mountain of lv_obj_create calls. Managing the memory and the pointers for that many objects on a microcontroller requires a lot of patience; especially when you want to add "breathing" animations to the most active days. If I had a penny for every time I had to debug a memory leak or a null pointer from a mismanaged UI object, I could probably buy a second T-Display.
Smart Features for a Desktop Display
Since this sits on my desk, it couldn't just be a "dumb" screen. I added a few quality-of-life features to make it a proper piece of hardware:
- Web-Based Config: On the first boot, the device acts as a WiFi Access Point. You connect with your phone, enter your WiFi credentials and bridge URL, and it saves them to NVS (Non-Volatile Storage). No hardcoding passwords!
- MQTT Integration: I can control the LCD brightness via my home automation setup. When I turn off my office lights, the display dims automatically.
- Automatic Rotation: The screen cycles through stats at weighted intervals; giving you more time to look at the complex grids and a quick glance at the text-heavy stats.
How to Build Your Own
If you have a LilyGo T-Display S3 laying around and you are already using the Strava statistics tool, you can get this running fairly quickly.
- Set up the Bridge: Point the
strava_bridge.pyat yourstrava.sqlite3file. - Flash the Firmware: Use PlatformIO to upload the code to your S3.
- Configure: Use the captive portal to link the two.
It is another desktop display in a world full of screens, but there is something different about this one. It doesn't show emails or Slack pings; it only shows the work you have put in.
Code available here: https://github.com/merlinmb/ESP32-T-DisplayS3-Exercise