More (Green) Glow on My Desk

Bringing the GitHub Contribution Graph to Life
There is a certain rhythm to a developer’s life, often measured in the small green squares of a GitHub contribution graph. For years, that graph lived behind a browser tab; a digital ghost of my productivity. But as I’ve rediscovered my love for 3 AM coding and the tactile world of IoT, I wanted to pull that data out of the screen and onto my desk.
My latest project does exactly that: a dedicated GitHub Contributions Monitor powered by an ESP32-C6.
The Why: Beyond the Browser
In my personal "creative outlet" phase, data is about inspiration. I wanted a physical object that served as a heartbeat for my projects: A reminder of the momentum I've built, glowing right next to my keyboard.
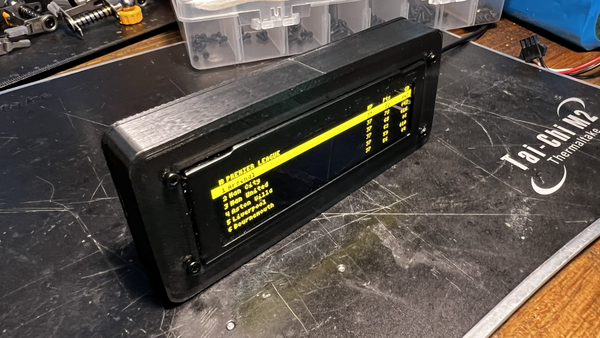
There is something deeply satisfying about seeing a year’s worth of effort rendered on a crisp 1.47" IPS display. It’s not just a "monitor widget"; it’s a tiny trophy for every bug fixed and every late-night breakthrough on an Arduino or ESP device.
The How: Seamless Integration
I designed this to be "set and forget," bridging the gap between technical complexity and hobbyist accessibility:
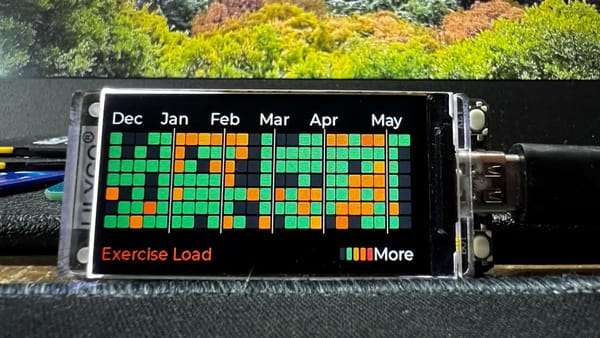
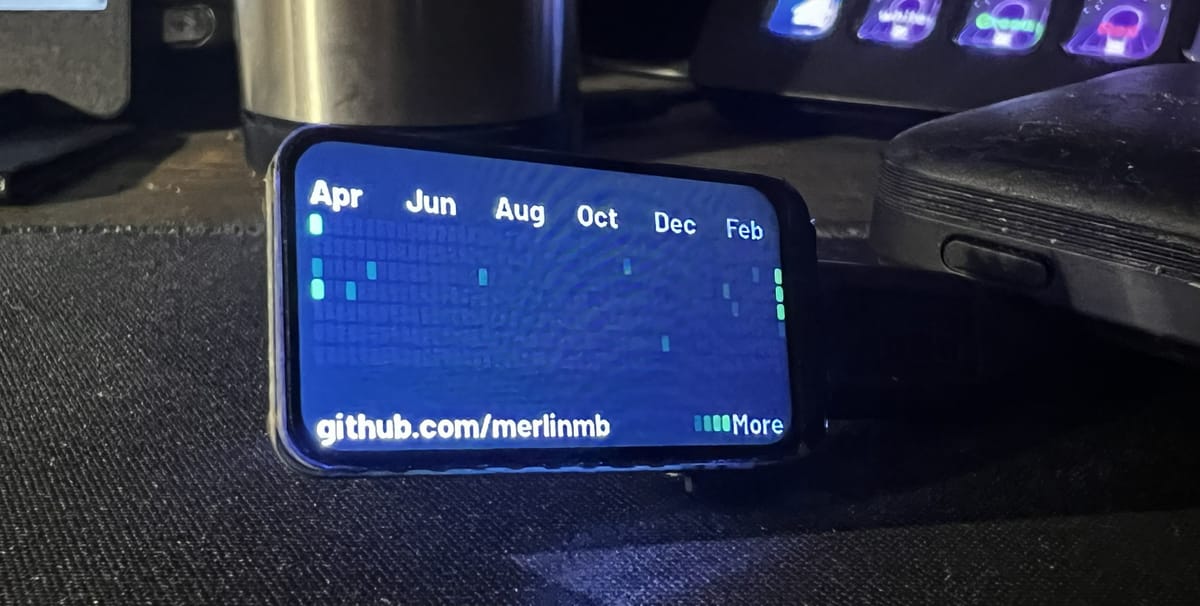
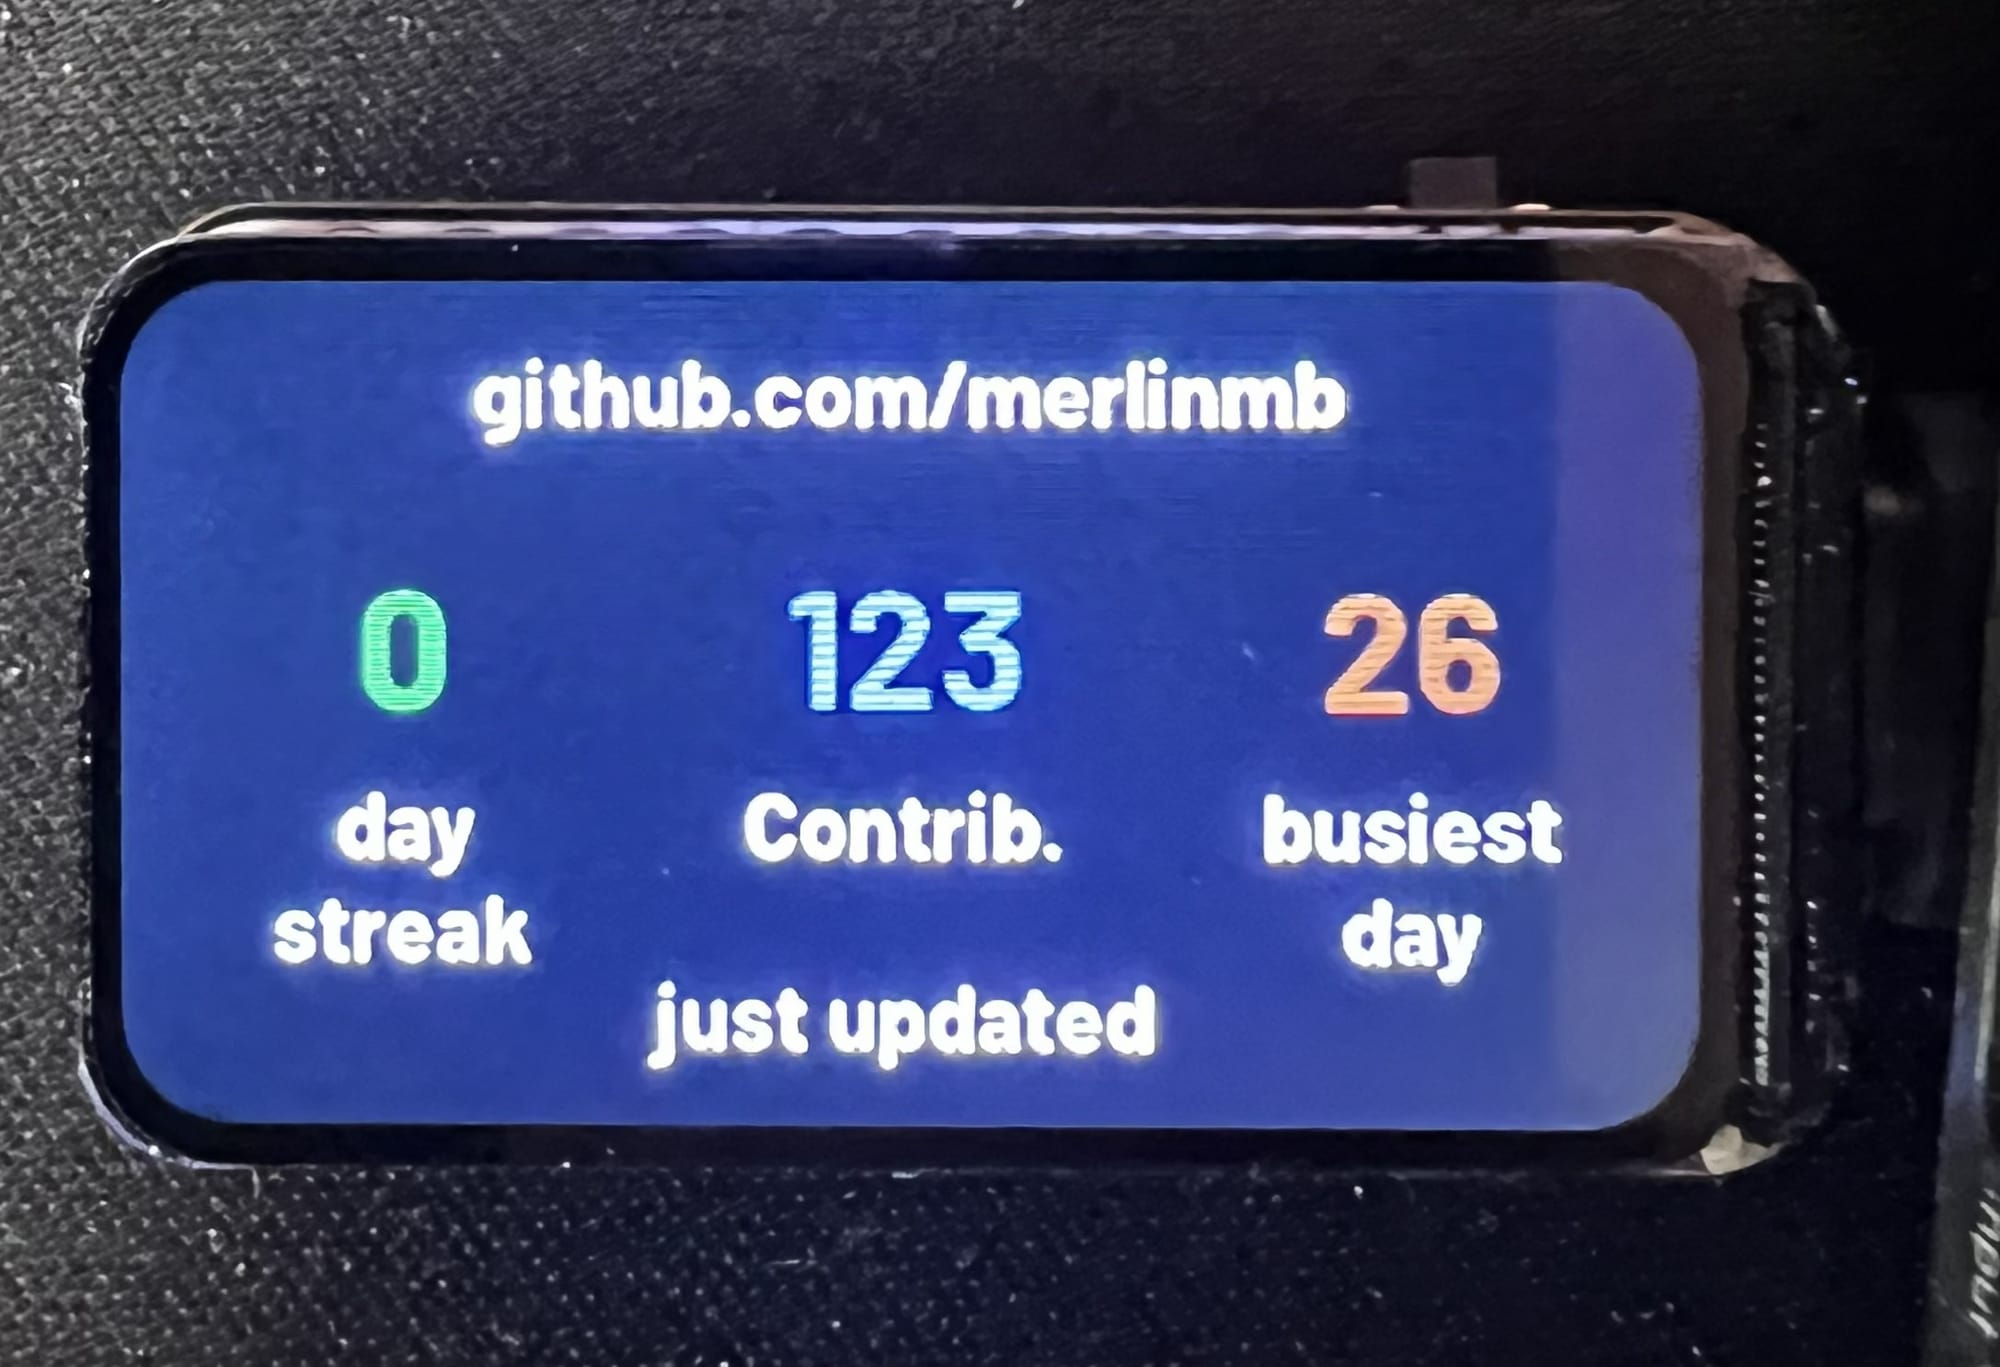
- The Visual Experience: Using the LVGL graphics library, the device renders a full 53-week heatmap using GitHub’s iconic green color scale. It doesn't just show the grid; it cycles to a stats screen that tracks current streaks and total contributions.
- Zero-Friction Setup: I wanted to avoid the "compile, flash, repeat" cycle. The firmware features a built-in Web Config Portal. On its first boot, the device acts as a WiFi access point. You simply connect with your phone, enter your GitHub details and WiFi credentials, and it’s live.
- The Tech Stack: It leverages an ESP32-C6 and the GitHub GraphQL API to fetch data securely. All settings are stored in the device's non-volatile storage, so even if I unplug it (reminiscent of my old ZX Spectrum days!), it remembers exactly who I am the moment it gets power again.
The Result
Now, instead of checking a website to see my progress, I just glance down. Seeing that "busy day" stat or a long streak displayed in a "breathing" animation provides that extra bit of creative fuel. It’s a small bridge between functional engineering and the personal joy of pure, hobbyist code.
It’s functional, it’s green (and it glows based on activity RGB!).
It’s a homage to coding: and to keep going, keep contributing.